This website is not intended for those under the age of 18 years old. For more information and advice, please visit gamcare.co.uk
You can click all images to enlarge them.
Key and Explanation 1

Key and Explanation 2

Key and Explanation 3

Key - Profit/Loss Settings and Results

Profit/Loss Settings Explanation
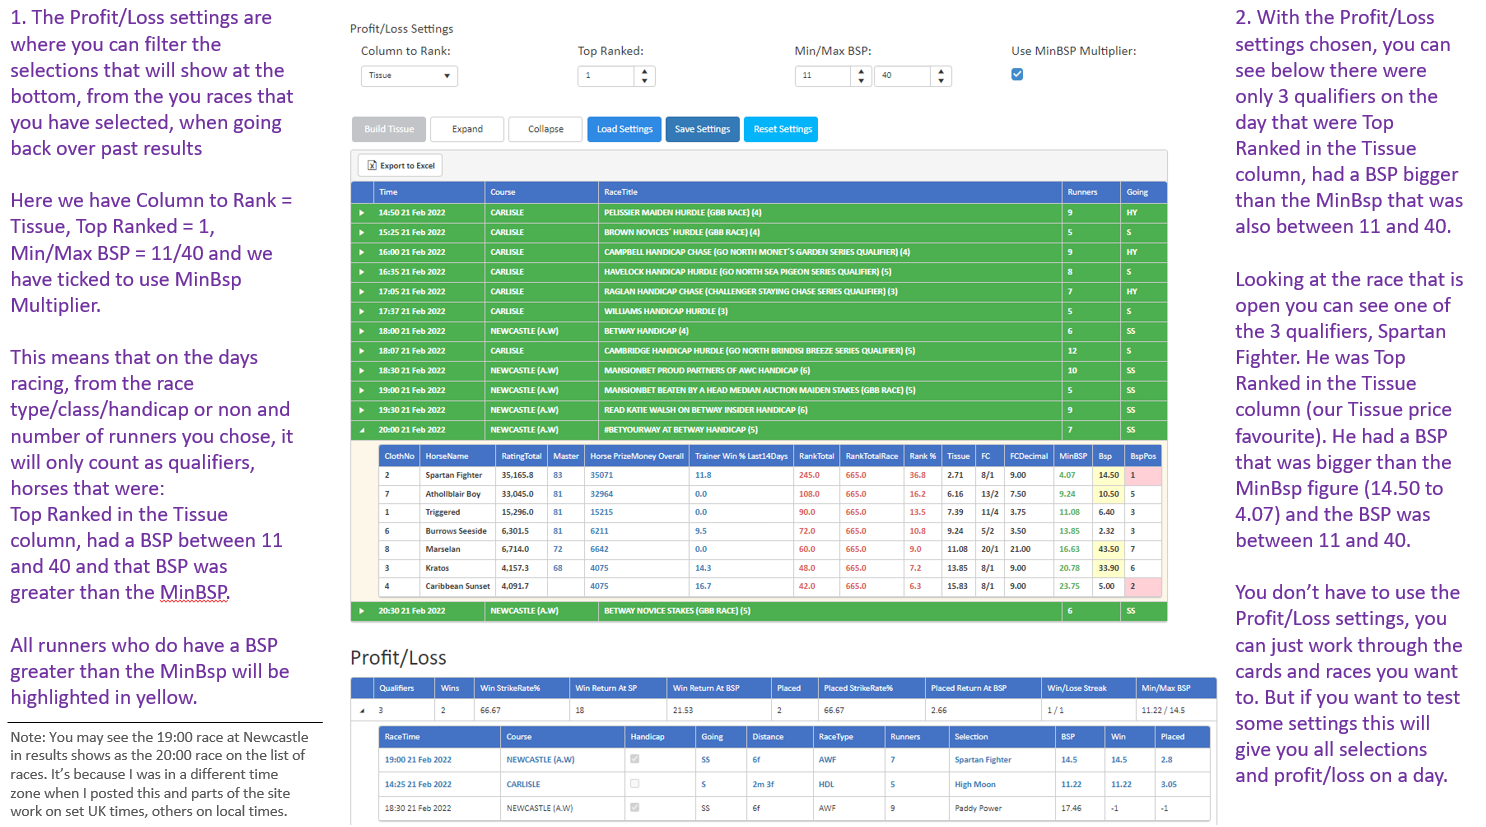
On the Betting Tissue Tool you have the Profit/Loss Settings underneath the main Settings. This enables you to filter your settings further and get a list of just the horses that qualified on your main settings plus your profit and loss settings.
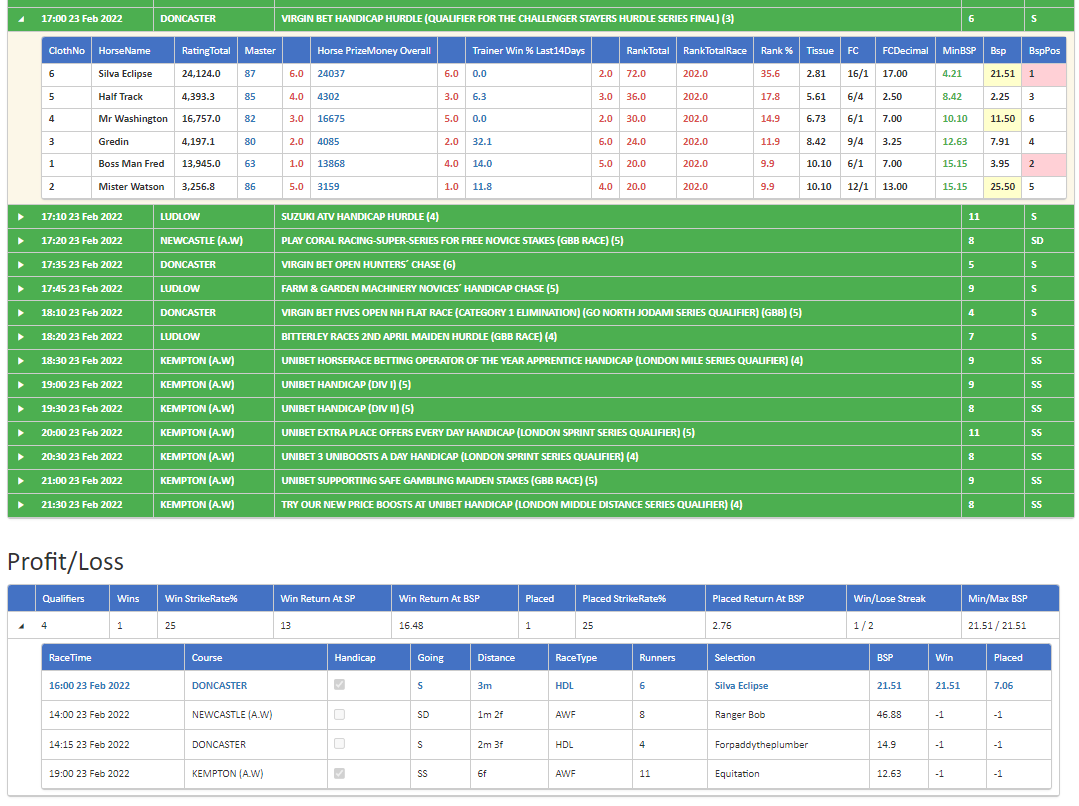
On the next image you can see I have chosen to only show in the results, horses that are Top Ranked (1) in the Tissue column (Column to Rank), where the BSP was between 10 and 51 (Min/Max BSP), that also qualify using the MinBSP Mutiplier (box ticked) setting you have chosen (horses shown in yellow in the BSP column).
All of the other settings are as they are on the working example explained earlier.


Below the list of races you have the Profit/Loss window which shows all qualifiers. As you can see there were 4 qualifiers on the day and one winner, Silva Eclipse at BSP 21.5.
It was a qualifier as it was top ranked in the Tissue column (lowest at 2.81, so our forecast price favourite), it had a BSP between 10 and 51, plus it is in yellow in the BSP column.
Column to Rank
Three choices on the drop down are Rating Total, Tissue and No Column. If you choose Rating Total or Tissue, by default this will only count and calculate the profit/loss for the Top Ranked (1) horse in either of these columns on Tissue Tool. You can however change the Top Ranked number to anything, so for example, changing the 1 to 3 on the Top Ranked setting will calculate the P/L for all top 3 ranked in your chosen column.
Use MinBSP Multiplier
There is more info on this on the second image from the top on this page however having this box ticked, means that you will only be counting horses that are highlighted in yellow in the BSP column. BSP will need to be selected as an additional field to see this on the page, again more details on this above.
So if you choose Column to Rank = Rating Total, Top Ranked = 1 and check the Use MinBSP Multiplier box, it will only count as qualifying horses, those that are top ranked in the Rating Total column that are also in yellow in the BSP column.
Min/Max BSP
Choosing between 10 and 51 as shown on the example image above, will then only count as qualifiers, horses with a BSP between 10 and 51.
So if you choose Column to Rank = Rating Total, Top Ranked = 1, have the Min/Max BSP set to 10 and 51 and check the Use MinBSP Multiplier box, it will only count as qualifying horses, those that are top ranked in the Rating Total column, with a BSP between 10 and 51 that are also in yellow in the BSP column.
Choosing No Column to Rank
You will need to check the Use MinBSP Multiplier. This will then count all horses on the day, shown in yellow in the BSP column, with a BSP between 10 and 51.
You can check your results going back to past days racing and currently for only one day at a time, so if you have a set of categories you want to test, just change the date at the top of the page, click Build Tissue and see the Profit/Loss for that day at the bottom.
Don't forget you can and should save your settings if you are happy with them so you can load them again another day.
Video Overview
A Working Example and 25/1 Winner
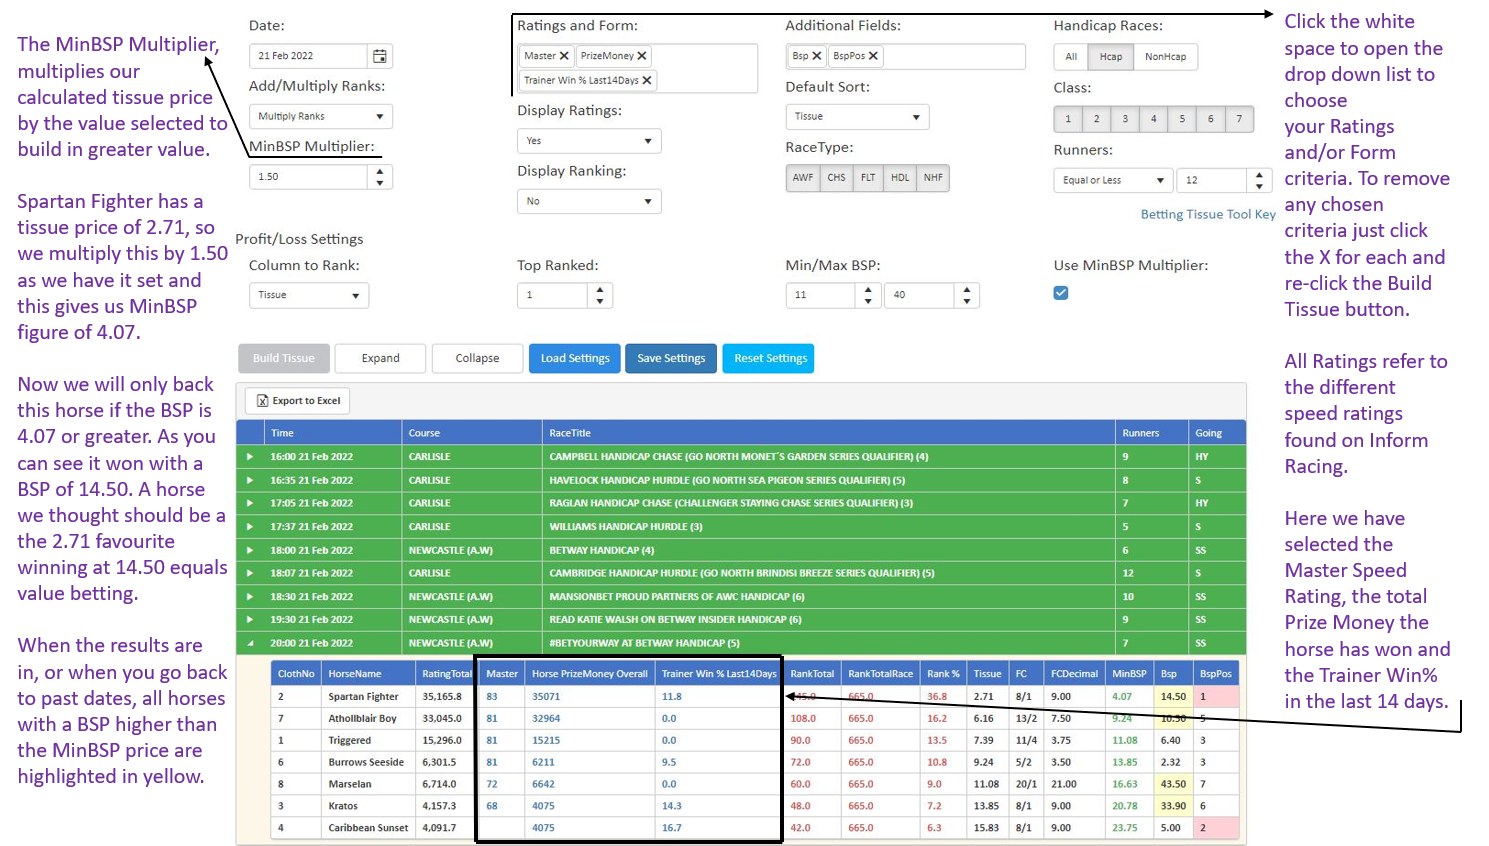
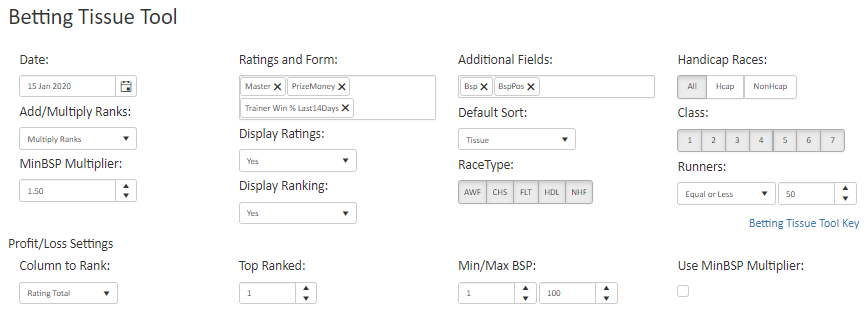
Below you will see two images showing the very simple settings I have chosen and then a race at Southwell where the settings have been applied. For this example I have selected the 'Ratings and Form' criteria very simply as:
Master - this is the Inform Racing Master speed rating and is the best speed rating achieved in the past 12 months.
Horse PrizeMoney Overall - Total winning prize money in pounds.
Trainer Win% Last14Days - Percentage of winners each trainer has had in the last 14 days.


You can see all of the resulting data for each category in blue. So for horse No.1 Cold Harbour the Master Rating was 82, the total winning prize money was £15,526 and the Trainer Win% was 26.1.
All of these figures are then ranked in order, shown in red, depending on the number of runners in the race. So as there were six runners, the horse with the highest Master rating gets 6 points. In this race there were two joint top rated horses, so they both got 6 rank points for the Master rating, the next gets 5, then 4, down to the lowest ranked of all. This is worked out for each Rating or Form criteria chosen and you can select as many or as few as you like.
On the settings you can see I have chosen to Multiply the Rank points, so for Cold Harbour you have 6 x 5 x 6 = 180 and you do this for all runners, then add these up to get the RankTotalRace figure of 366. From here you work out the Rank% for each horse against the total for the race, so the Cold Harbour rank total of 180 is 49.2% of 366 and that gives us a Decimal Tissue price of 2.03, or just over Evens.
When you have your Tissue price you want to increase this or multiply this to ensure that you are betting at bigger prices to gain your 'value bets' every time. I have chosen to multiply the Tissue price by 1.5 as you will see on the settings.
So the Tissue price of 2.03 X 1.5 = 3.05 and that is now the minimum Decimal price, or price on the betting exchanges that you will want to achieve before placing a bet. All minimum prices you want for each horse are shown in green in the MinBSP column.
Race result and explanations.

Now look at the finishing positions and the BSP of each runner on the right and you will see that Tyrsal won at a handsome BSP of 25.71. You can see that whilst the real Forecast Price (FC) in the Racing Post was 25/1 for this horse, taking our chosen criteria, ranking these and creating our own Betting Tissue and 'value' tissue odds, we rated the horse at 5.08, or just bigger than a 4/1 chance.
Quite a big difference I am sure you will agree! By multiplying this 5.08 by the 1.5 means that the minimum, value betting price we wanted for this horse was 7.63. Not only was the actual price much bigger, giving us massive value bet on this particular runner, it was the only horse in the race that started at higher than the MinBSP figure.
So how did we get such value bet on the rank outsider in a six runner race?
Most punters would just look at the basic form of each horse before the race - if they even bothered to do that - and if they did that for the winner Tyrsal they would have seen very average form figures of 45846 and that the closest the horse had come to the winner in any of these races was four lengths.
The handicap mark of 46 was the same as it was for the previous three races so there was no big drop in handicap mark either. Then whilst the trainer Phil McAtee would be respected on the All Weather, the jockey Gavin Ashton was a fairly unknown seven pound claimer with only a handful of wins under his belt.
Seemingly fair enough to be forecast at 25/1 you would think?
How the betting tissue tool and the data that we chose calculated some very different and perhaps far more accurate odds.
As you can see from the race image above, using just the three simple categories of Master rating, previous winning prize money and the recent trainer form, Tyrsal had the second highest total ranking number of 72. This meant that compared to the rank total for the race of 366, we calculated that the horse really had a close to 20% of winning and should have been forecast at nearer 4/1 than 25/1.
Even if you did look at the form factors that I chose and realised that there was more to this horse than its odds would suggest, how would you then decide on what would be a value price to accept compared to all of the others in the same race?
Only by automating the whole process simply and effectively, can you calculate the correct odds that every horses should be and you only need to be reasonably accurate with your choice of settings and form criteria that you choose, to be able to be successful and make money from horse racing and your value bets.
Can you start to see how the Inform Racing Betting Tissue tool will be invaluable when searching for big, value priced winners?
I have suggested before that once you have created your betting tissue, that you concentrate on the first five horses by your calculated Tissue odds. This means you should be focussing on those that do really have a chance and ignoring any that are simply too wide of the mark, going by price.
This is of course up to you and you can play around with all of the settings and combinations until you are happy, but by using the simple rules above and only looking at the first five horses in each race - I also selected just Handicaps on the settings - there was a close to 20% strike rate of winners on the day and a healthy profit made too.
Also, at this Southwell meeting, six of the seven winners were found from the first two in my betting tissue forecast, with the winning BSP's of 11.29, 9.02, 4.11, 2.18, 5.14 and 25.71, so you very could very well look to use this for finding Placepot bets, placed bets only or dutching more than one horse in a race.
Conclusion
When value betting you will be placing bets that have a greater chance of wining than those implied by the Bookmakers.
By using more detailed form criteria than others would be bothered to and then using the Betting Tissue Tool to rate, rank and calculate all of the odds for each runner on the day in seconds, you can look forward to making long term profits, knowing that you are getting value odds on every single bet that you place.
There are hundreds of combinations you use combing the ratings and/or form criteria to perfect your very own betting forecasts.
Using the Betting Tissue Tool will allow you to seek out and placing only those bets which you feel are giving you value. As we know, it is all about getting value with your bets.
So from as little as £3.85 a week, less than most people place on just one bet, you can start finding your way to value betting and add another angle to your betting strategies.
